Ergebnis zur Landtagswahl 2013 am 15.09.2013
Landkreis Cham - Markt Neukirchen b.Hl.Blut
Es wurden alle Stimmbezirke ausgewertet.
Wahlbeteiligung, Stimmzettel, Stimmen
| Wahlbeteiligung: | 53,01% |
|---|---|
| Stimmberechtigte: | 3.126 |
| Wähler: | 1.657 |
| Ungültige Erststimmen: | 10 |
| Gültige Erststimmen: | 1.647 |
| Ungültige Zweitstimmen: | 45 |
| Gültige Zweitstimmen: | 1.612 |
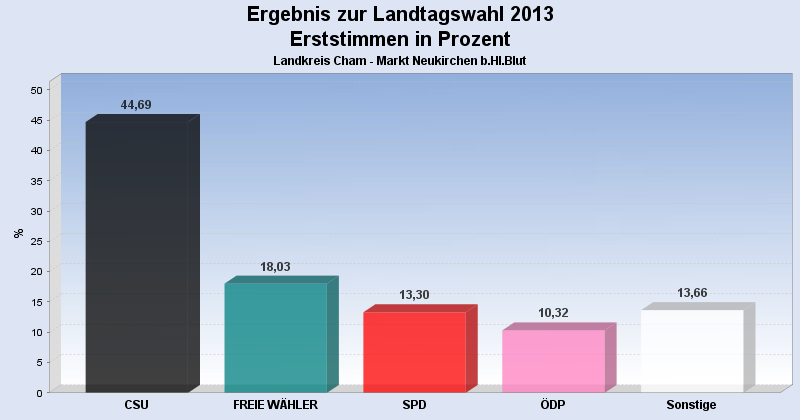
Erststimmen nach Wahlvorschlag
| Partei | Erststimmen | Prozent | |
|---|---|---|---|
| 1 | Dr. Hopp, Gerhard ( CSU ) | 736 | 44,69% |
| 3 | Dr. Vetter, Karl ( FREIE WÄHLER ) | 297 | 18,03% |
| 2 | Zimmermann, Claudia ( SPD ) | 219 | 13,30% |
| 7 | Riederer, Sepp ( ÖDP ) | 170 | 10,32% |
| 10 | Volkholz, Christine ( BP ) | 68 | 4,13% |
| 11 | Schütz, Markus ( PIRATEN ) | 54 | 3,28% |
| 4 | Christoph, Stefan ( GRÜNE ) | 39 | 2,37% |
| 5 | Fries, Josef ( FDP ) | 23 | 1,40% |
| 9 | Riehl, Franz Xaver ( NPD ) | 19 | 1,15% |
| 6 | Stoiber, Siegfried ( DIE LINKE ) | 16 | 0,97% |
| 8 | Amann, Fritz ( REP ) | 6 | 0,36% |
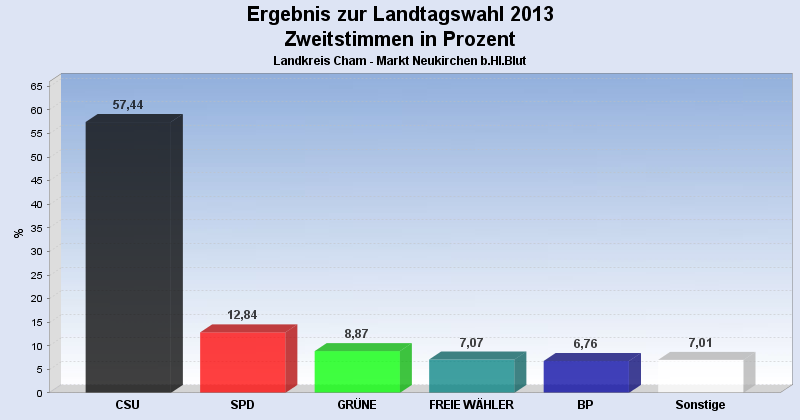
Zweitstimmen nach Wahlvorschlag
| Partei | Zweitstimmen | Prozent | |
|---|---|---|---|
| 1 | CSU | 926 | 57,44% |
| 2 | SPD | 207 | 12,84% |
| 4 | GRÜNE | 143 | 8,87% |
| 3 | FREIE WÄHLER | 114 | 7,07% |
| 10 | BP | 109 | 6,76% |
| 7 | ÖDP | 27 | 1,67% |
| 11 | PIRATEN | 20 | 1,24% |
| 5 | FDP | 20 | 1,24% |
| 8 | REP | 19 | 1,18% |
| 9 | NPD | 15 | 0,93% |
| 6 | DIE LINKE | 12 | 0,74% |
- Stand: 03.02.2014 17:31:49
 Diagramm
 Seitenanfang